🔬Results Studio Overview
How to navigate through the Waldo Results Studio and begin investigating your test results.
- Results Studio tour
- The Playback Panel
- The Step Comparison view
- The Timeline
- The Dependency Inspector
Results Studio Tour
Your Results Studio view will quickly surface any issues with your test, providing you with a clear line of sight as to when and where the error occurred.
To enter the Results Studio view:
- Navigate to Runs icon (stoplight) on the menu located at the left hand sidebar
- Click on the test run you want to analyze
- Click into the specific test you want to view
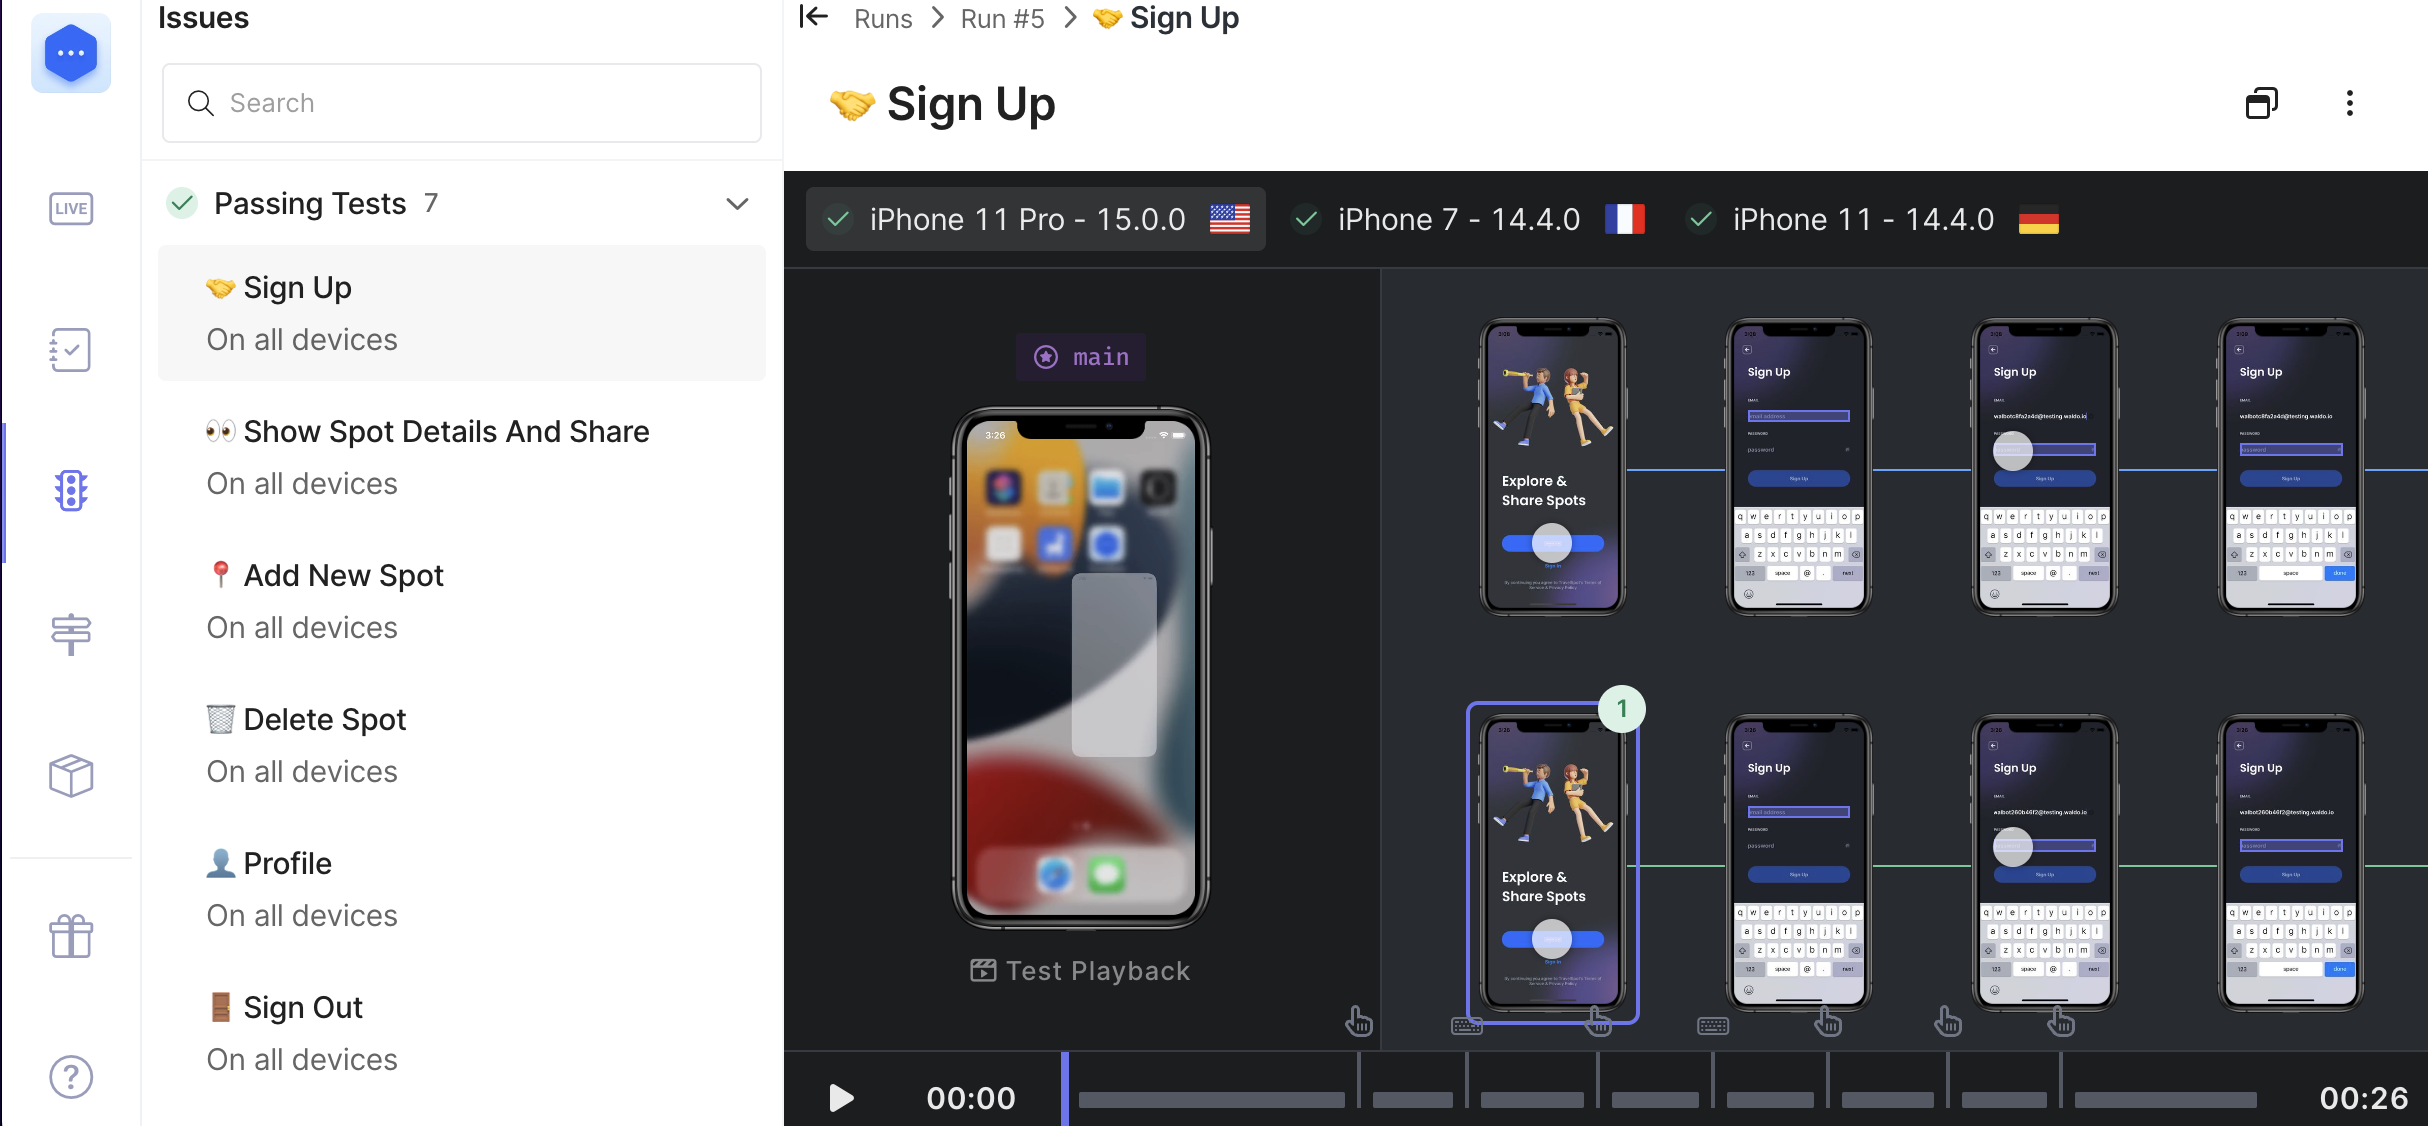
You are now in the Results Studio, as pictured below:
You can also access the Results Studio from the Test page:
- Click on the tests icon (booklet with checkmark) on the left sidebar menu
- Select the test you want to view
- At the bottom of that test, you will see the recorder flow of your test run
- Below that, you should see a small square labeled “Latest” (pictured below). Click this to be taken directly to the Result’s Studio view for that test.
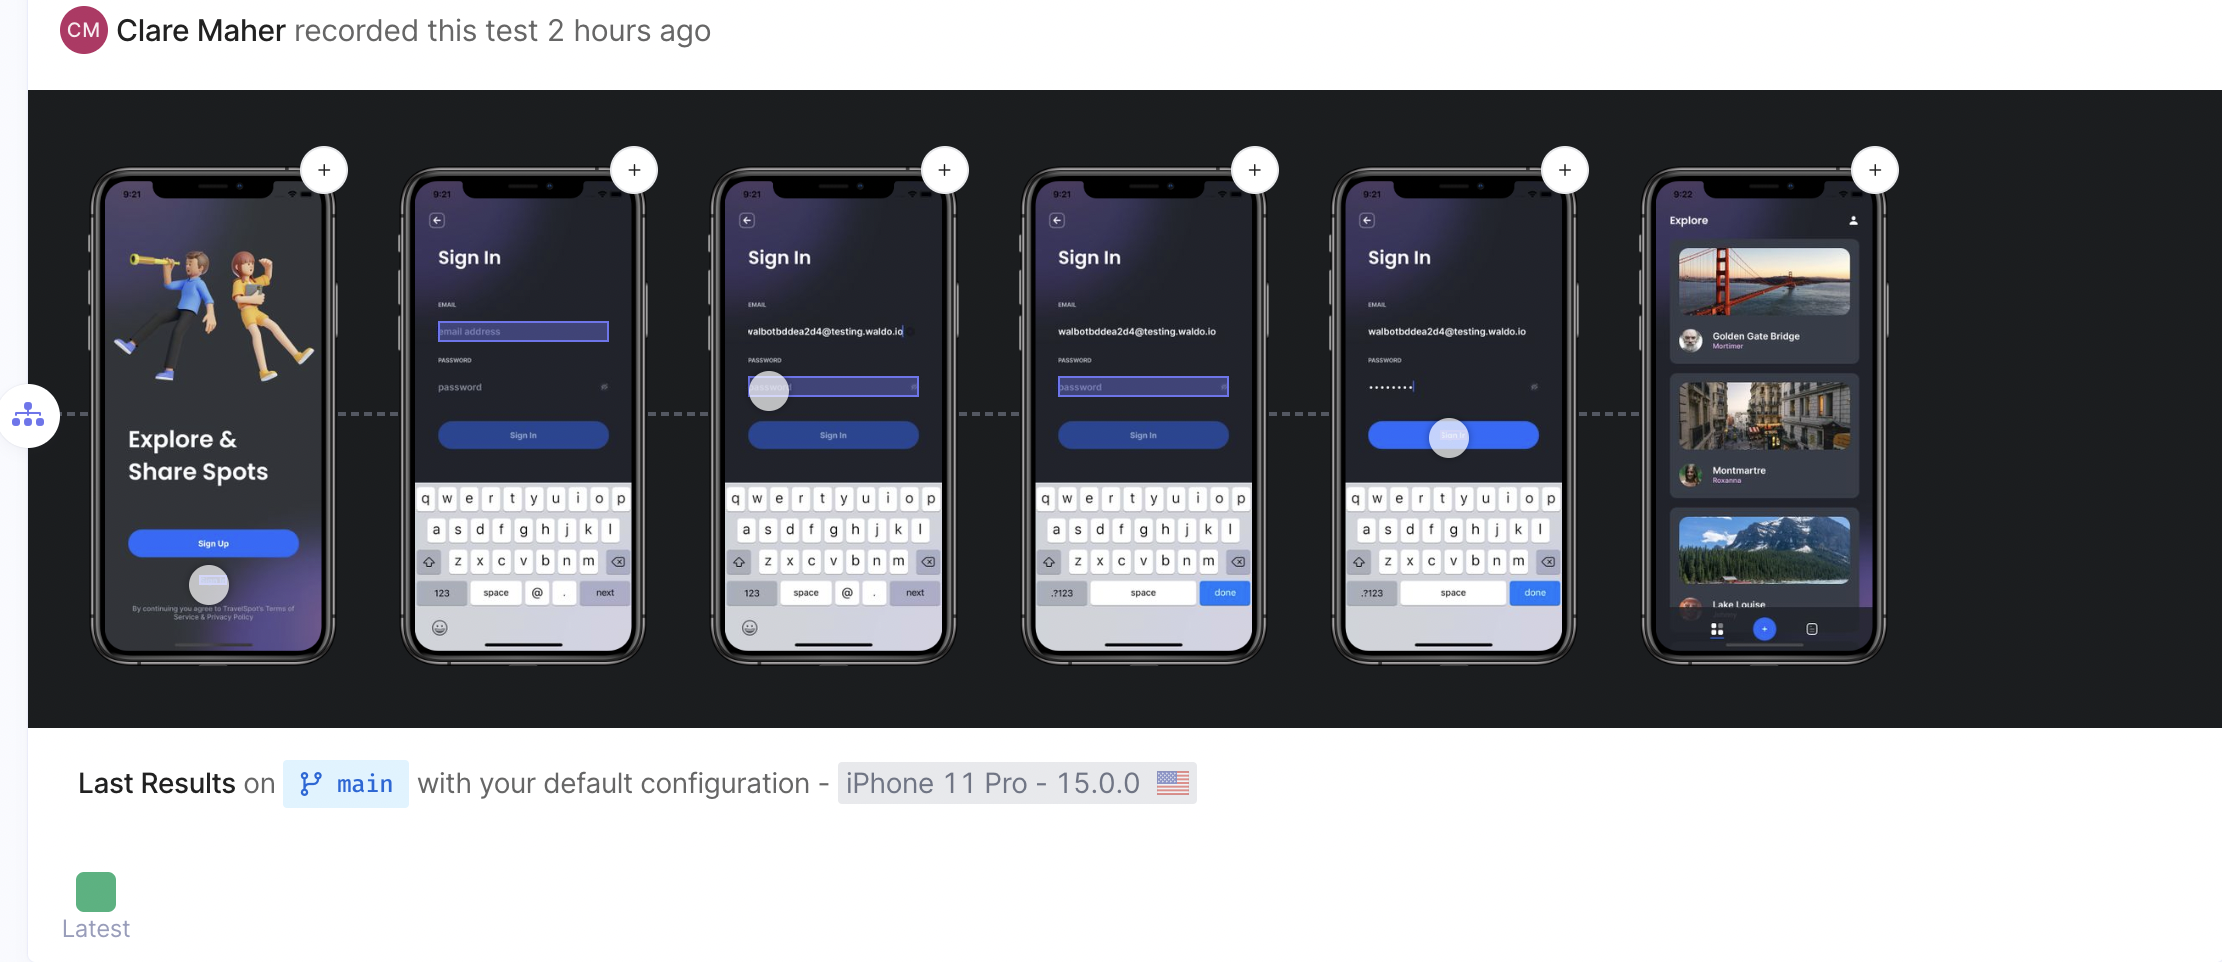
Understanding the color coding of your "latest" resultThe “Latest” test square at the bottom of the screen will be color coded to indicate if the test passed or failed. You may see a 🟩 on some, or a 🟧 and 🟥 on others.
🟩 Green means Passing , 🟧 Orange means Flaky, and 🟥 Red means Failing. The squares are ordered to represent the results of each sequential test run.
The Results Studio consists of four key components, which we will go through below:
- The Playback Panel
- The Step Comparison view
- The Timeline
- The Dependency Inspector
The Playback Panel
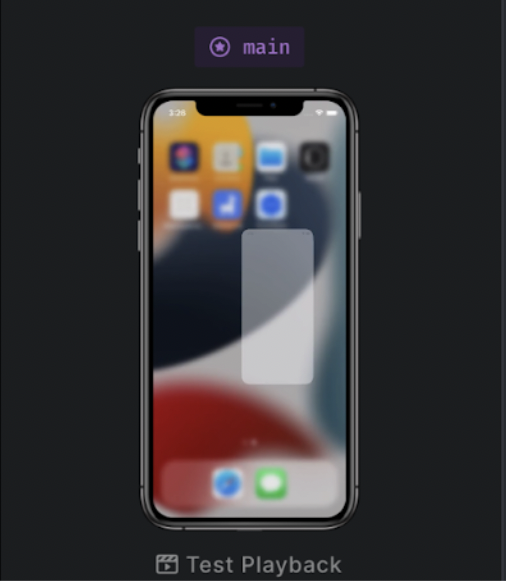
The Playback Panel allows you to replay a video of your test, so you can see in real time what happened during the course of the test run. This will be displayed on the large device screen on the left hand side of your Results Studio screen.
The Step Comparison view
This view will display as two rows phone screens running parallel to one another.
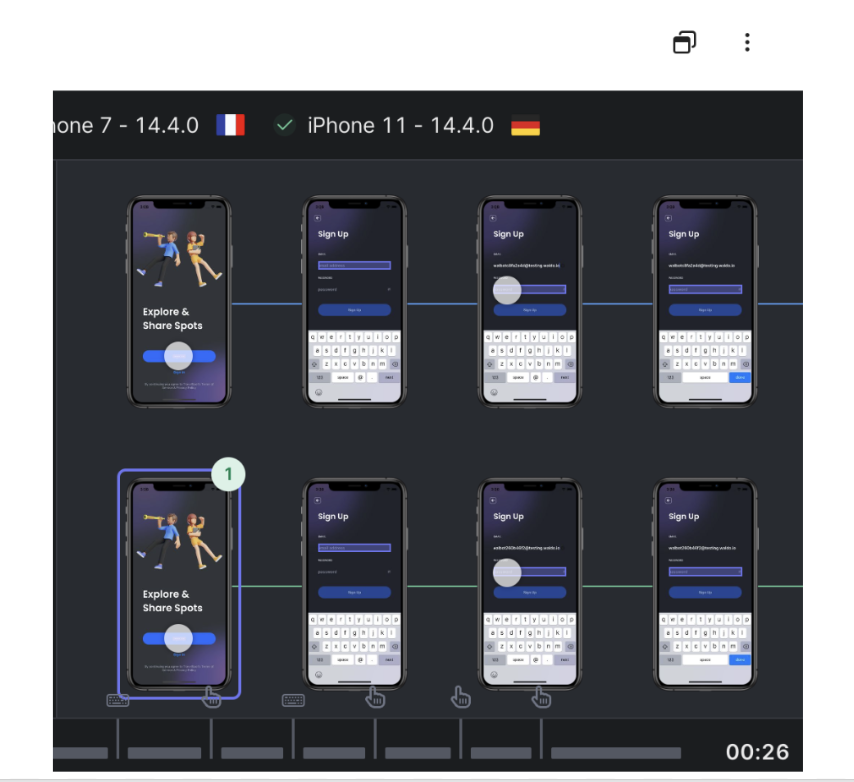
The top row is your expected result. This is your baseline run: a successful interaction with your application that Waldo is comparing the tested build to.
The bottom row is your actual result. The actual result is the step by step breakdown of the test displayed on the Playback Panel, ie your most recent or selected test run.
The Timeline
The Timeline is located at the bottom of your Results Studio screen, and indicates the time it takes for your test app to pass through the assertions in a given step.
The Dependency Inspector
You can open the dependencies inspector by clicking the icon on the top right corner of the Results Studio screen.
Surface issues with dependencies quicklyThis is a quick way to tell if your test failed as a result of one of the dependencies associated with the run. For more on dependencies and chained testing,click here.
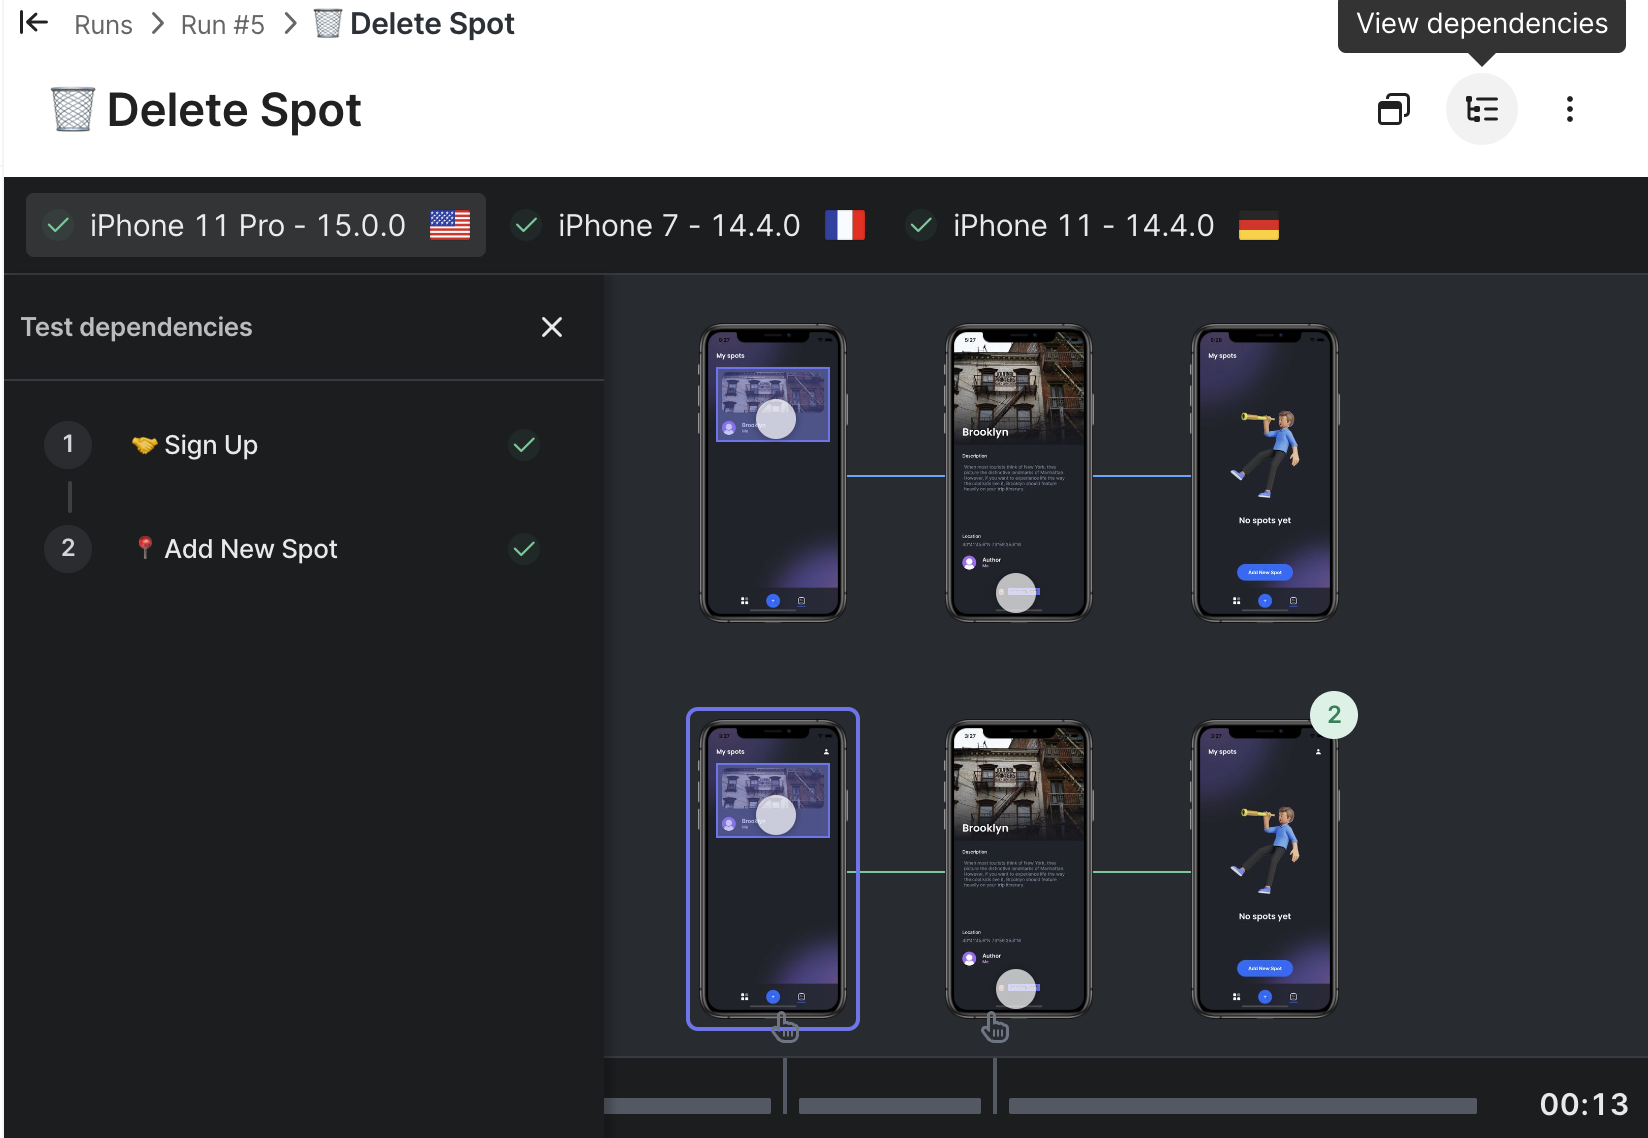
You can also use the menu in the top right of the Studio to:
- Retry your testing flow
- Download the logs breaking down your test
- Download the build associated with the test
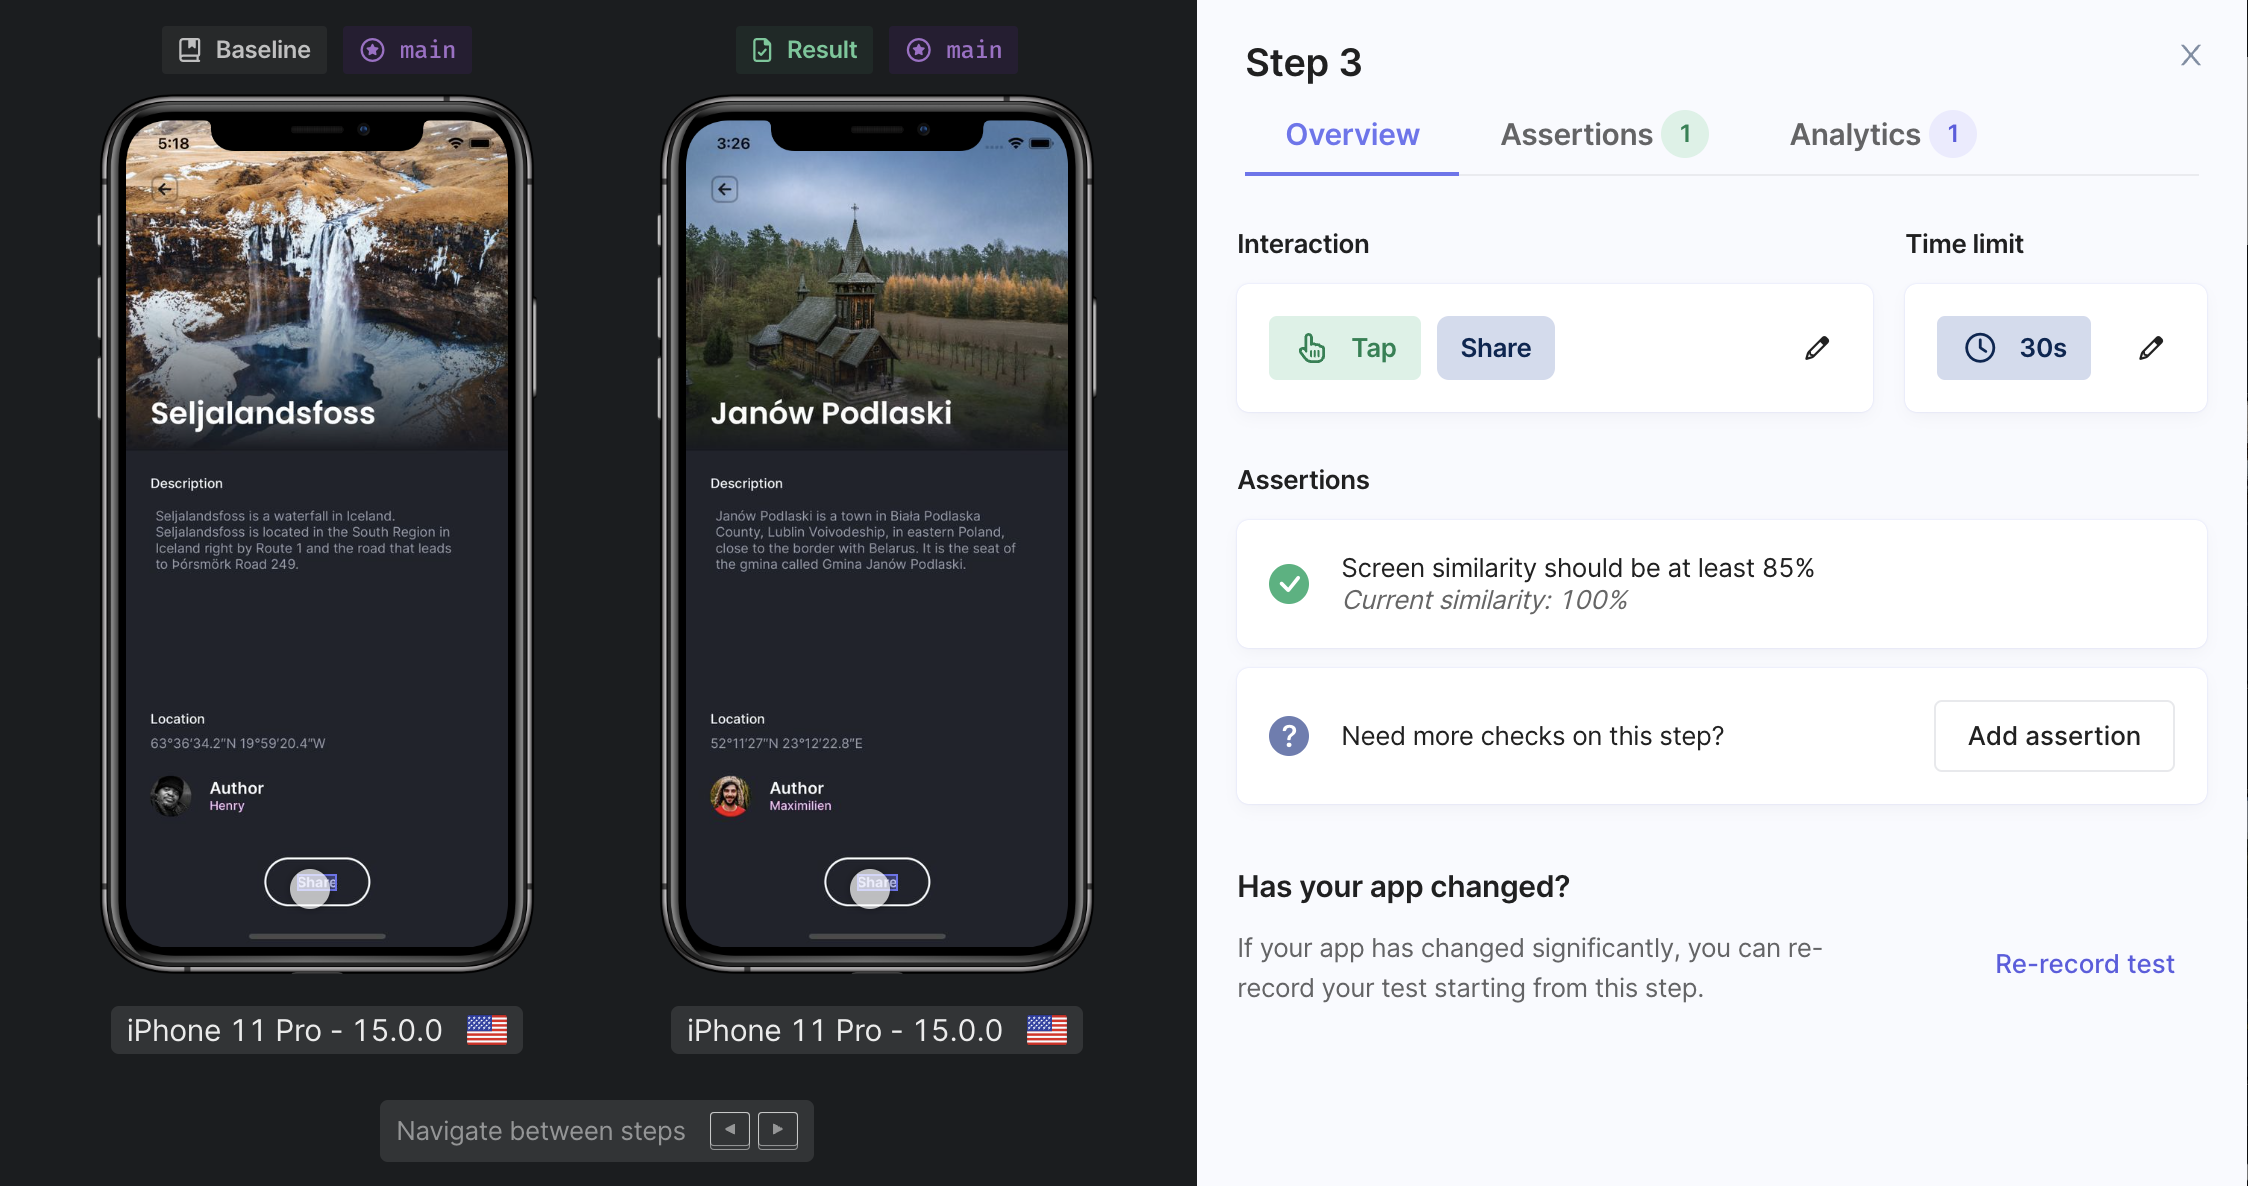
To open up a zoomed in version of your step by step comparison, click on the mirrored screen icon to the left of your dependencies (when provided) and menu icon. This will allow you to show each step of your test directly alongside the corresponding step in your baseline recording.
It will also display:
- The assertions applied to the test
- If/how the assertions were met
- The interactions that took place in that step
- Additional analytics
Updated 6 months ago
